
12/2021 : Nutrient Variation

An exciting year, this past one!
Last summer, we released a report detailing nutrient variation in the food supply. We tested 3,662 samples of twenty-one different crops; three types of roots, eight leafy greens, eight fruits (and vegetables), and two grains.
These samples were analyzed in three labs across two continents as part of the Bionutrient Institute network. Samples came from over 160 farms (78 farm partners in the USA + 83 European farms). Thirty-one citizen science partners also submitted samples from grocery stores, farms, farmer’s markets, and bodegas.
We assessed 18-19 metrics in those crops, including antioxidants, polyphenols, Brix, protein (in grains only), and 15 individual elements, documenting these nutrient levels.
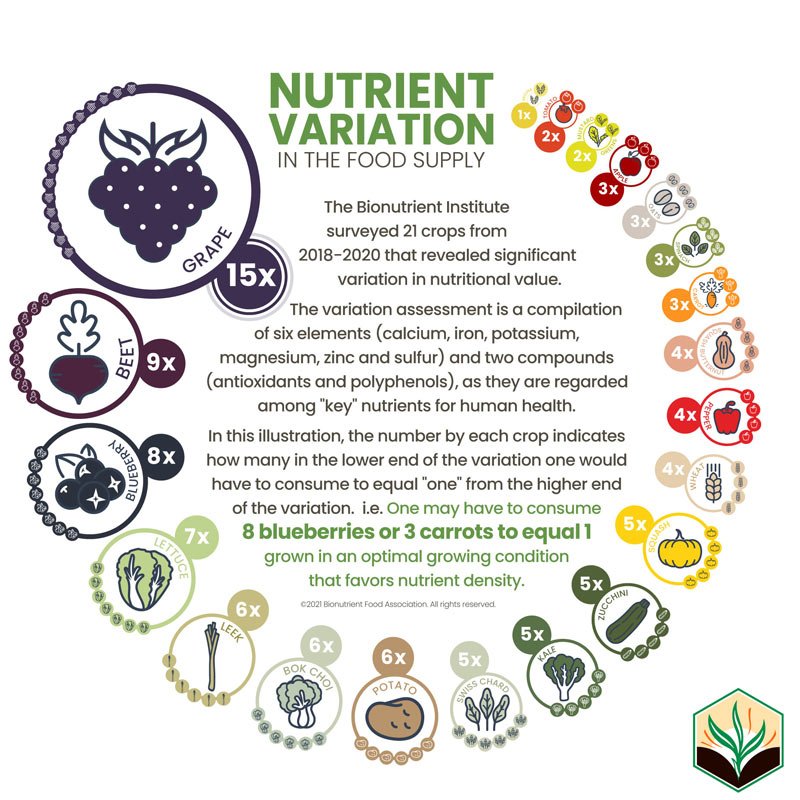
Depending on the nutrient and the crop, the overall variations from top to bottom could be from 2:1 to 10:1 to 60:1 or more.
Because one doesn’t just eat the copper from a carrot without the zinc as well, we averaged the variations to come up with a simple range to show from high to low what the overall variation was that we found in each crop.
This graph shows the average variation in those crops across all those nutrients. So, from the graph, the best butternut squash we found in the study had an average of 4 times as many of these nutrients in it as the worst one did. With beets, it was 9:1.
We also broke out the levels of unique elements in different crops and the variation we found there. For example, one serving of wheat (pasta or bread) could have 6% of the USDA Recommended Daily Allowance (RDA) of potassium, or it could have 24%. This is an example of a 4:1 variation.

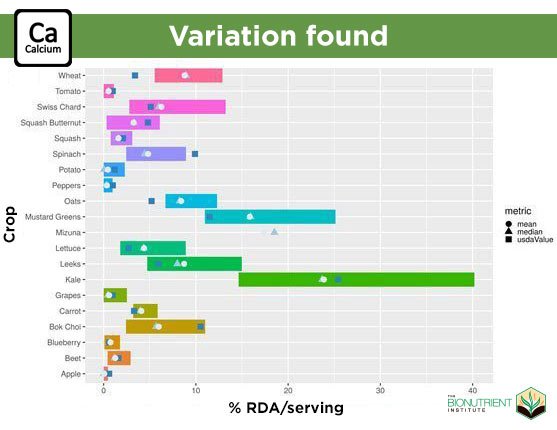
One serving of kale could have 15% of your RDA of calcium or 40%. This would be an almost 3:1 variation.
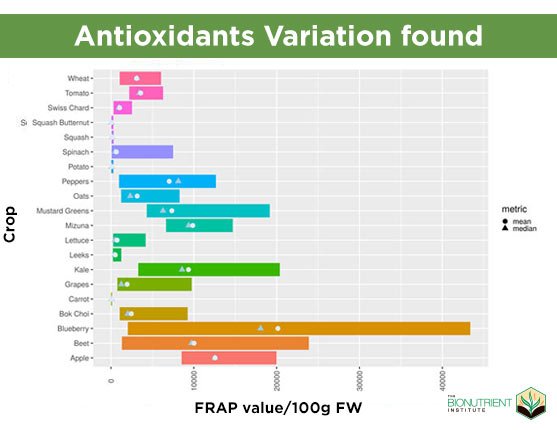
We also looked at health-giving compounds from crops, antioxidants, and polyphenols. While there is no RDA for these compounds, they are understood to be health beneficial. Blueberries, for example, are understood to be high in antioxidants. We found that a 100 gm sample (about 4 ounces) could have 3,000 units or 43,000 units of these nutritious compounds. This is a more than 13:1 variation.
Having shown that this significant nutritional variation exists in food across all of these crops, the fundamental question “How much variation exists?” has been well investigated. While certainly more work is still to be done here, for us, it has been preliminary to accomplishing our overall objectives.
Now we move to the next step of our work: Defining Nutrient Density. Variation in nutrients is one thing. To be able to say where this carrot is in the continuum of nutrient-density is the entire objective.
This is what we are committed to and what we expect the market will take up in support of the disruption of agriculture towards the betterment of all life.
Along with our partners and supporters, we will have accomplished that first nutrient density definition in beef by this time next year. Then we will be positioned to repeat the process for the world’s top 20 crops in the next 3-5 years.
With your help, this will be done, and then I, for one, can go back to spending more time farming!
Enjoy the season,